Application of the EURAD modeling system to a sommer smog episode in July 1994 with special emphasis on the urban plume of Berlin
M. Memmesheimer, J. Tippke, H.J. Jakobs, G. Piekorz, M. Weber,
G. Schneider, A. Ebel, M. Kerschgen
EURAD-Project
The aim of the field experiment BERLIOZ planned within the framework of the German Tropospheric Research Programme (TFS) in the principal subject 3 (LT3) is the tracing of the Berline plume and the analysis of all processes important for the formation of ozone and other photo-oxidants. The general aims are the improvement of forecasts of summersmog episodes based on a better understanding of the processes involved (including the improvement of chemical mechanisms) and the improvement of emission control strategies for air quality.
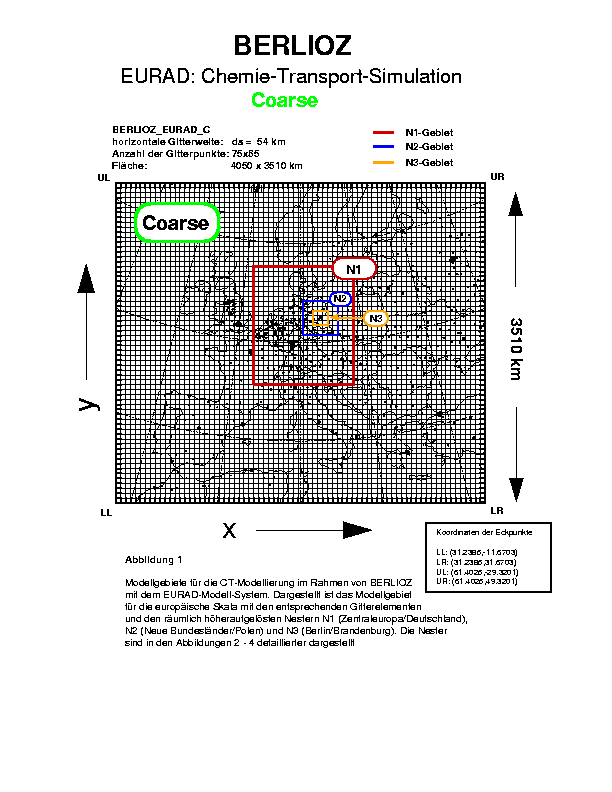
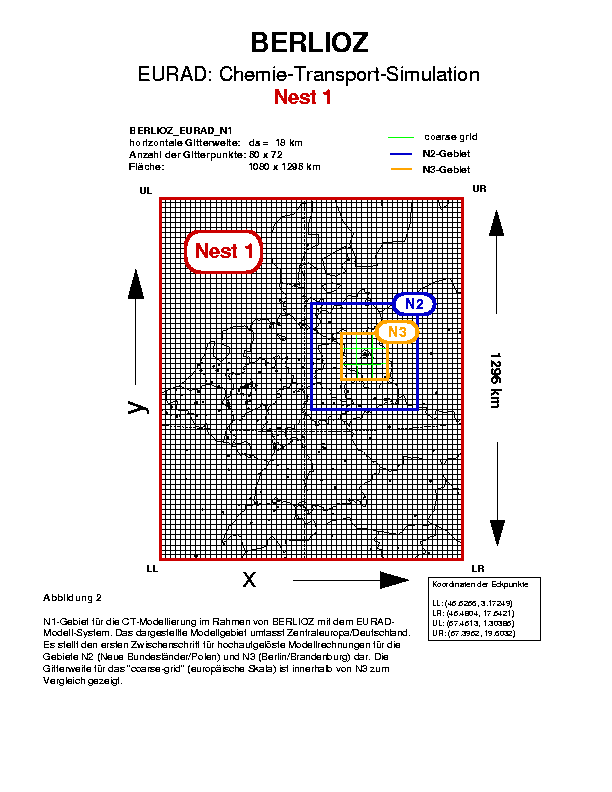
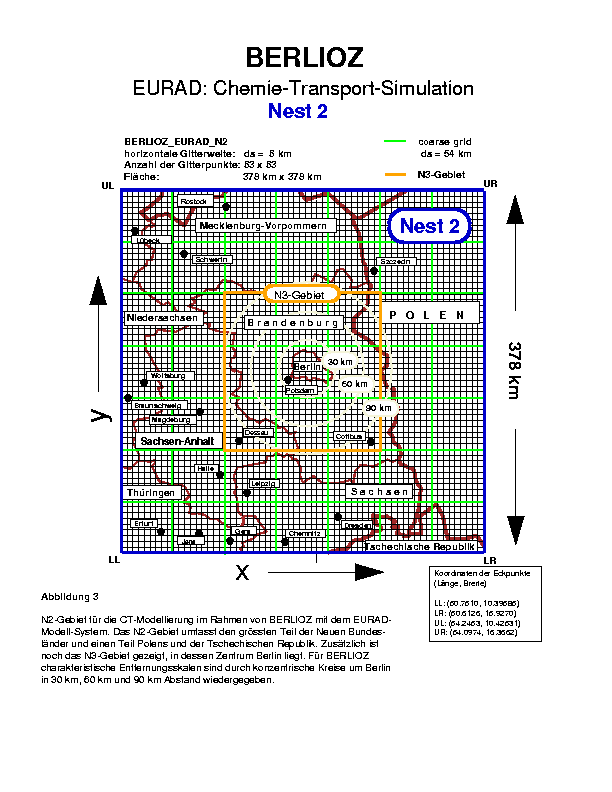
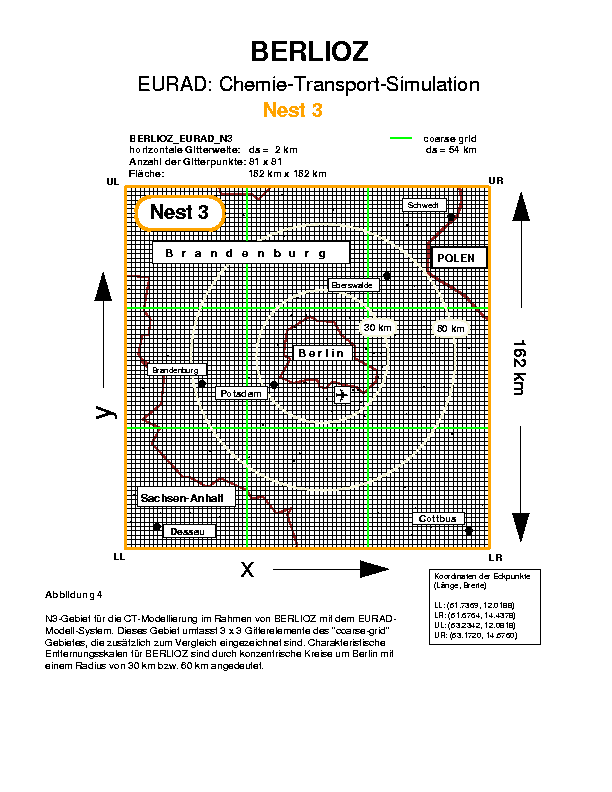
The comparison of measurements with model results from 3D models with dynamics and chemistry is also an important subject within the TFS. Model development, application and evaluation is the major task of the principal subject 1 (LT1) of the TFS. One of the models which is used within TFS-LT1 is the EURAD modeling system developed during the phase 1 of EUROTRAC. As a pilot study for the preparation of the BERLIOZ experiment the EURAD modeling system is applied to a typical summer episode using the nesting capabilities of the model. This allows for a consistent simulation of the European scale down to the urban scale. The model design with its domains is shown in Figure 1. The episode selected is from summer 1994 and covers the time span from July 21 - July 30, 1994. The input data used are from recent work done within the TFS (emissions and landuse) at the IER, University of Stuttgart and the IFU (Garmisch-Partenkirchen).
The episode is selected as a test case because the summer 1994 was characterized by stable and warm weather over Central Europe. In particular in Central Europe the temperature deviation from the average reaches 4 degrees. These weather conditions favour the formation of photooxidants over Europe. This caused the so called ozone alert in the German Federal State Hessen at three times (July 26th, July 31st, and August 4th, 1994) within a time span of about three weeks at the end of July/beginning of August 1994 (Bruckmann and Wichmann-Fiebig, 1997). In the case of ozone alert the provisional summersmog ordinance was applied in Hessen with speed limits for all vehicles (90 km/h on motorways; 80 km/h on other roads).
The July/August episode has been also used as a test-case to investigate the effects of measures to reduce the emissions of precursors of ozone (NOx and VOCs) (Hass et al., 1994; Schoenemeyer et al., 1995; Stern et al., 1995, 1997; Memmesheimer et al., 1995; Tippke et al., 1997; Motz et al., 1996). A research project combining measurement campaigns (including flight measurements) and modeling has been undertaken in Berlin and Brandenburg (FLuMOB-Project, Stark et al., 1995) to investigate the urban plume of Berlin. Within the Tropospheric Research Programme (TFS) and EUROTRAC-2 the summer-smog episode 1994 is one of the episodes selected as a test case for model evaluation and model development (Memmesheimer et al, 1997, 1998).
The results of the model simulations presented here as movies for different atmospheric constituents are based on the the version 01 of the status report (Memmesheimer, et al., 1998). The aim of the status report is to present the actual results obtained so far with the EURAD modeling system for the European Scale as well as for the local scale in the Berlin/Brandenburg region where the BERLIOZ experiment is planned to take place. Any suggestions and critical remarks are welcome and hopefully help to improve future updates of the report.
Simulations have been performed using the nesting capabilities of EURAD. CT-calculations have been done for four domains: Coarse Grid (CG), Nesting Level 1 (N1), Nesting Level 2 (N2), Nesting Level 3 (N3)
The results for the CT-simulation are presented as movies for all domains, for Ozone and NO2 in layer 1 (0 - 70 m) and layer 7 (1300 - 1800 m).
| CG | N1 | N2 | N3 | |||||
|---|---|---|---|---|---|---|---|---|
| Layer 1 | Ozone | NO2 | Ozone | NO2 | Ozone | NO2 | Ozone | NO2 |
| Layer 7 | Ozone | NO2 | Ozone | NO2 | Ozone | NO2 | Ozone | NO2 |
15 layers are used for all domains to resolve the vertical structures of the atmosphere for the base case, which is documented here. The upper boundary is at 100 hPa, about 7-8 layers are expected to be in the well-mixed planetary boundary layer for summer conditions (layer 8 covers the height region from 1800 - 2500 m).
The land use data have been extracted from the data base of the TFS-LT1 at the BTU of Cottbus. They have been generated by G. Smiatek from the IFU , Garmisch-Partenkirchen. Emission data has been provided by the IER, University of Stuttgart (Friedrich, Wickert, Schwarz). Meteorological fields are based on simulations with the mesoscale meteorological model MM5 which has been applied using a two-way nesting approach. The MM5 is driven by input data from the ECMWF.
We start the discussion with a description of the near-surface ozone concentrations for the European scale shown for July 21 - July 30, 1994 (CG: Ozone (layer 1 and layer 7))
Ozone concentrations in the near-surface layer 1 over Europe based on the coarse grid simulation (54 km resolution) are shown for the each day of the episode starting with July 21, 00 UTC and ending with July 30, 00 UTC, 1994. In the beginning of the episode ozone concentrations in the afternoon are in the order of 60 - 80 ppb for most parts of Central Europe. Higher values can be found along the coastal areas near the larger cities, in particular in the Mediterranean. During the following days ozone concentrations as simulated with the model increase to more than 90 ppb for large areas in Central Europe. In the first days of the episode (July 21 - July 24) the high ozone concentrations mainly can be found over the western part of Central Europe. After July 25 the wind direction turns from predominately easterly flow to westerly and southerly flow over Central Europe. The area with high ozone values shifts after July 25 towards Eastern and Northern Europe (Poland, Scandinavia, Baltic Sea and Baltic States).
Some remarks on the ozone concentrations on 06 UTC: At that time ozone has remained over the water surfaces during the night due to missing deposition and missing conversion to NO2. Long-range transport is evident on July 25/26 over the North Sea with concentrations of more than 90 ppb. The Mediterranean sea, the baltic sea and the black sea also show high nighttime ozone which might have been produced by photolytic reactions during the days before. In contrast to that, ozone decreases to calues of 30 - 40 ppb over continental surfaces during the night.
Long range transport is more clearly pronounced in elevated layers of the atmosphere as shown for ozone in layer 7. The interaction of dynamics and photochemical production is shown for a height region corresponding to layer 7 of the model (about 1300 - 1800 m). In the beginningof the episode some ozone is transported towards the Atlantic ocean (July 21, 22, 23). During July 24 and July 25 evidently polluted air and ozone originating from the UK and Central Europe is transported over the North Sea. During the following days ozone-rich air is transported to Norway (July 26), Sweden (July 27), Finland (July 28) and again to Sweden and the Baltic Sea during July 29 and July 30. High ozone concentrations over the eastern part of Germany (Berlin/Brandenburg) at elevated layers can be found after July 27 (residual layer). As expected, night-day variations in ozone for layer 7 are of less importance compared to the near-surface layer.
For layer 1 the NO2-concentrations reflects mainly the distribution of the main emission regions in Europe and the daily variation of the mixing height. Therefore the highest NO2-values are found in the morning (low mixing height and high emissions during the rush hour). NO2 at layer 7partially also reflects the mixing during the day and the changes in the effective emission height of the point sources. The major industrialized and urbanized regions in Europe can be identified clearly, in particular in the UK, the Po-valley, southern Poland, Sachsen, and the major cities (e.g. Madrid, Petersburg, Moscow, ...)
The results of the N1-domain are shown for layer 1 and layer 7.
Urban plumes of major cities (Berlin, Vienna, Munich, Kopenhagen, Hamburg) can be identified with this grid resolution. The larger-scale environment important for the Berlin plume can be inspected on the basis of the results for N1-domain.
As it can expected the major features are similar to those found in the CG-domain. However, major cities, in particular Berlin are more clearly present. This resolution allows to trace the Berlin plume over larger distances during the night, e.g. on its way to Hamburg with southeasterly winds (layer 7). The west-east propagation of regions with high ozone concentrations is more clearly visible in the N1-domain. Until July 24 ozone concentrations increase to more than 70 ppb in the afternoon for most areas of the western part of the domain whereas in Poland ozone even at noon is only between 40 - 50 ppb. The effect of the emissions from Berlin with ozone concentrations between 60 - 80 ppb in the Berlin plume during the first phase (July 21 - July 25) of the episode is also evident. After July 25, Berlin is partly influenced by photochemically aged air originated from the western and southern aereas of the domain.
During the night hours ozone decreases in the near-surface layer with concentrations below 30 ppb over large parts of the domain, in particular in the accumulation phase of the episode until July 25th. In the Berlin/Brandenburg region ozone concentrations in the morning are in the order of 30 - 40 ppb during the episode. Only a small increase of ozone (about 10 - 15 ppb) is seen in the near-surface layer in the Berlin/Brandenburg area from the beginning til the end of the episode. The ozone distribution on July 28 might be an example for possible interaction of ozone remaining during the night over the Baltic sea with air in the Berlin/Brandenburg area.
Over the continent the spatial patterns of ozone in the near-surface layer and layer 7 are similar due to the strong turbulent mixing within the planetary boundary layer during noon and afternoon. Long range transport is more evident at layer 7, e.g. during July 25th. During the night large amount of ozone remains in the residual layer. For the Berlin/Brandenburg area ozone increases strongly in layer 7 from 40 - 50 ppb in the beginning of the episode to more than 80 - 90 ppb afterJuly 26th. It can be expected that the large amounts of ozone from the residual layer contribute considerably to the ozone concentrations in the near-surface layers.
NOx-concentrations, which are more directly controlled by the emission rates as ozone are in the range of 50 ppb and more over the Benelux and Nordrhein-Westfalen similar to the CG-calculations. The major source regions for precursors of ozone southward of Berlin (Leipzig, Dresden; Czech Republic; Niederlausitz (Cottbus)) can be identified on these movies (layer 1 , layer 7), but more clearly in the N2-domain (see below).
In the elevated layer 7 the effect of increasing mixing height during the day and the changing effective emission height can be seen.
Due to the better horizontal resolution is can be seen that in the Berlin/Brandenburg area ozone formed within the Berlin plume is only one of the interesting features (layer 1, layer 7). During the days with easterly or southeasterly wind southward from Berlin a second ozone plume often appears with similar concentrations as in the Berlin plume. This plume is formed by precursor emissions from the industrialized regions near Cottbus (Schwarze Pumpe, Niederlausitz) and can be mixed up with the Berlin plume under certain conditions (e.g. July 25th). Other source regions which also are reflected in the ozone distribution are near Szczecin northeastward from Berlin and clearly at the southern edge of the Nest2 domain in the highly industrialized regions of Sachsen (Dresden, Leipzig, Halle).
There is litte increase of ozone during the episode and near Berlin ozone concentration during the episode are in the order of 30 - 50 ppb for the early morning hours. The 28th of July, however show ozone concentrations of more than 70 ppb northward from Berlin. This belongs to an air mass which extends from the baltic sea with concentrations of even more than 80 ppb (outside the N2 domain; see the corresponding movie from Nest 1. It has been formed during the day before (July 27) over the baltic sea and intrudes into Mecklenburg-Vorpommern during the night and to Brandenburg in the morning of July 28.
With a horizontal resolution of 6 km the highways and major streets can be seen in the NO2-concentration fields in the afternoon as well as in the morning. Concentrations in the afternoon are in the order of 0.5 - 5 ppb for most parts of the N2 domain, but can change considerably from day to day (July 23 and July 30 are saturdays; July 24 is a sunday), depending on meteorology and emission rates. In the morning the modeled concentration range is in the order of 5 - 10 ppb for the more polluted areas (Berlin, Sachsen, Niederlausitz).
The ozone concentration for the lowest layer of the model (layer 1) as expected shows patterns which are very similar to those present for the N2 domain with a grid size of 6 km. However, on July 22 and 23 ozone concentrations exceed 80 ppb in the urban plume of Berlin which is not the case for the N2 simulation. The plume of air with increased ozone concentrations southwest of Berlin is the second dominant features in the case of southeasterly winds. It is a common feature in the simulations which is also present on other days. This plume is caused by emissions in the Cottbus-Niederlausitz area.
It is also obvious that the Berlin plume moves out of the N3 domain in the afternoon and during the night. In particular in layer 7 which is not longer within the mixing layer after 18 UTC, ozone still increases compared to 14 UTC and moves out of the N3 domain. The further fate of the Berlin plume after 14 UTC can better be seen in the N2 domain. Most of ozone formed in the Berlin plume at 18 UTC is located just southeastward from Schwerin, even at July 22 with concentrations of more than 80 ppb (layer 7). The Niederlausitz-Cottbus-plume and the plume from Magdeburg and Dresden/Halle/Leipzig at 22 UTC are not longer separated. This plume is located westward from Berlin at layer 7. Air with enhanced ozone concentrations due that plume remains westward from Berlin during the night and is still located westward from Berlin in the morning of July 23.
The ozone concentration in the morning shows the small changes in the average for the early morning hours during the episode in the N3 domain more clearly. In general the concentrations found over Berlin are in the order of 30 - 50 ppb. Some smaller scale features (e.g.: July 25 and July 26) near Berlin with ozone less than 30 ppb are due to major point sources with large NOx-emissions (see below). Except for July 29 ozone concentrations in layer 7 in the afternoon shows very similar, nearly identical patterns compared to those of layer 1. At 06 UTC the importance of accumulated ozone in the residual layer over Berlin/Brandenburg after July 25 can clearly be seen. In particular on July 21 and July 22 ozone concentrations in the morning are only 10 - 20 ppb higher in layer 7 (40 - 50 ppb) compared to layer 1 (30 - 40 ppb) - in contrast to July 27th where simulated ozone concentrations are in the range of 80 - 110 ppb over the Berlin/Brandenburg area compared to 30 - 50 ppb in the near-surface layer.
Simulated NO2-concentrations in the afternoon are in the range of more than 10 ppb in the city plume of Berlin, and about 2.5 - 7.5 ppb along the major highways. The city plume and in particular the motorways are more clearly present in the results of N3, as it can be expected due to the higher resolution. In the morning NO2-concentrations for larger areas are in the order of more than 10 ppb within the motorways and the city plume, 25 ppb are exceeded in the simulated NO2-concentrations only within limited areas, 50 ppb is only exceeded on July 29 due to low wind speed. This is in general the same as in N3 domain, but with somewhat increased concentrations near the motorways and within the city plume. In particular the concentrations in the plumes of point sources are clearly higher for N3-simulation results (e.g. July 23). NO2-concentrations also seem to be lower for July 23, 24 and 30 in the morning. This might be due to lower traffic emissions because July 23 and July 30 were saturdays and July 24 was a sunday.
![]()
This report is the first version of simulations with the EURAD modeling system with respect to the urban plume of Berlin. The simulations have been performed to support the field experiment BERLIOZ in summer 1998. As a test case, a summer smog episode in July 1994 has been selected (FLUMOB-episode). Simulations has been performed for three nest levels starting with the European-scale (grid size 54 km), and refining down to a grid size of 2 km for the Berlin/Brandenburg area. For all four domains simulated with the EURAD-CTM results has been shown for NO2 and ozone with respect to the temporal evolution during the episode.
First findings are:
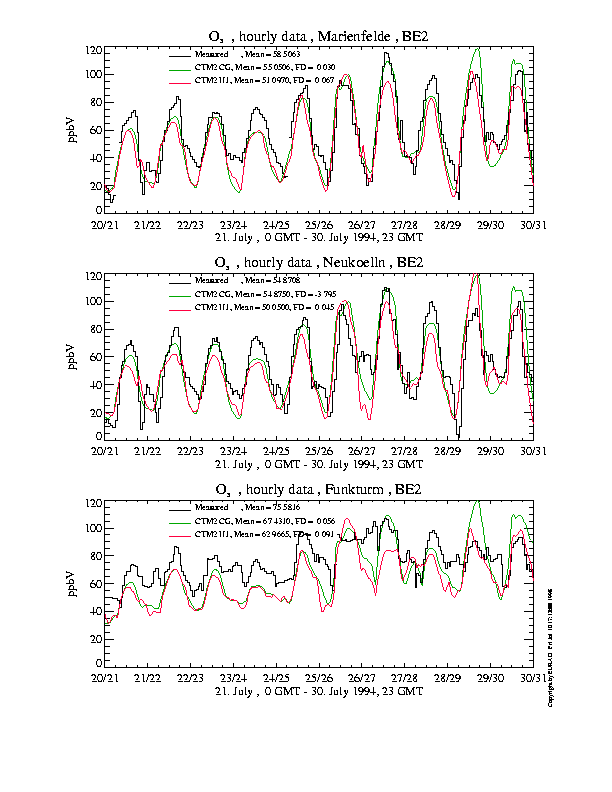
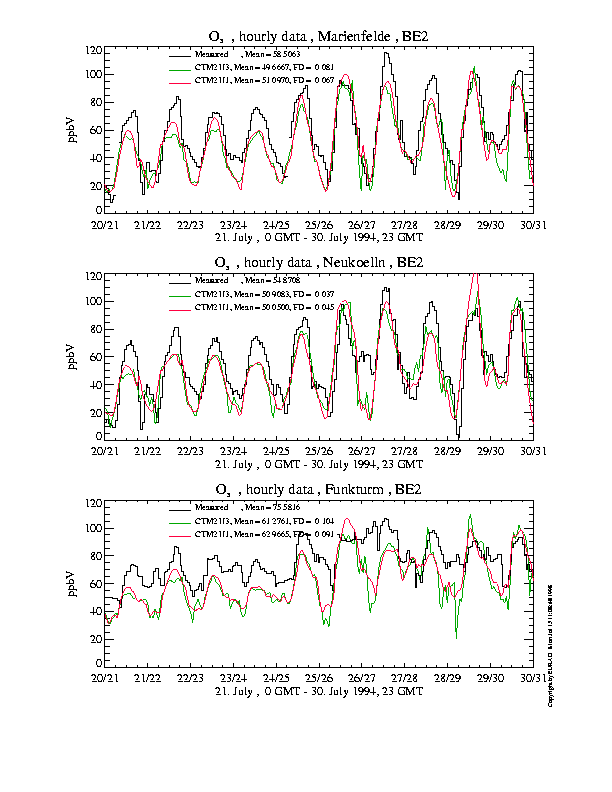
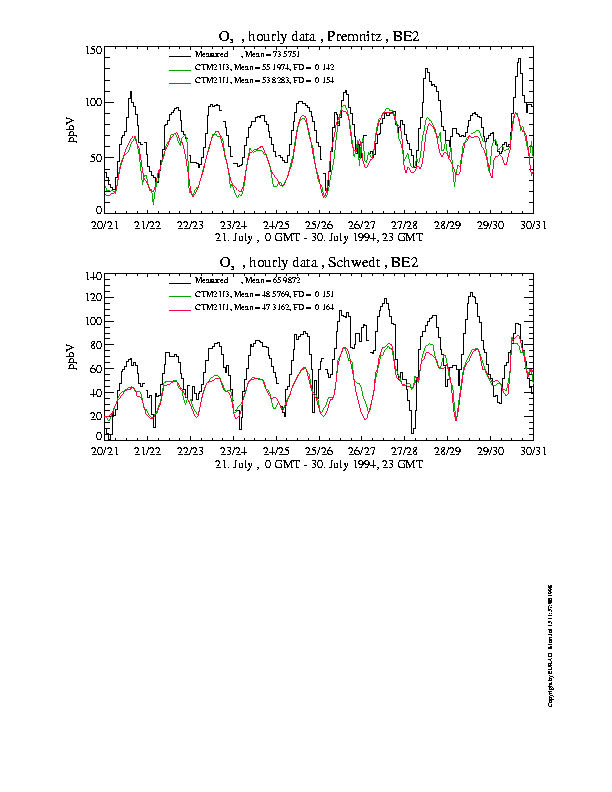
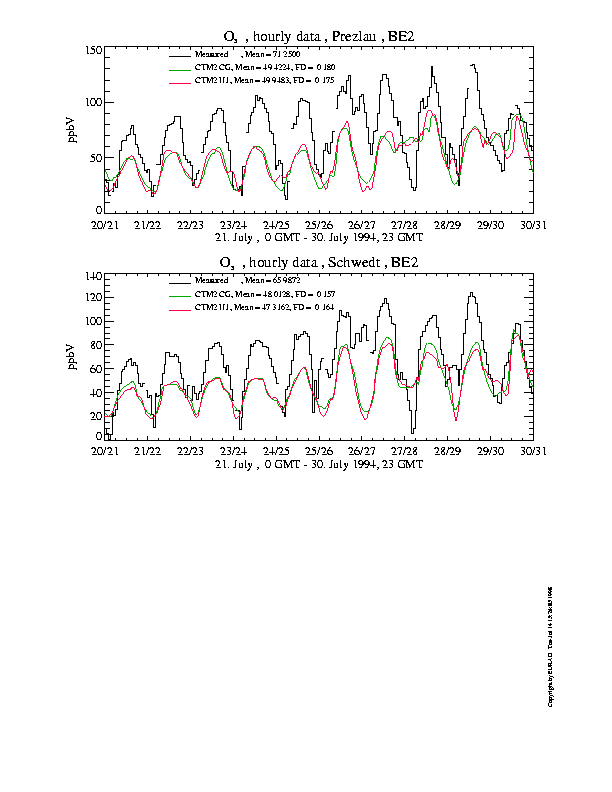
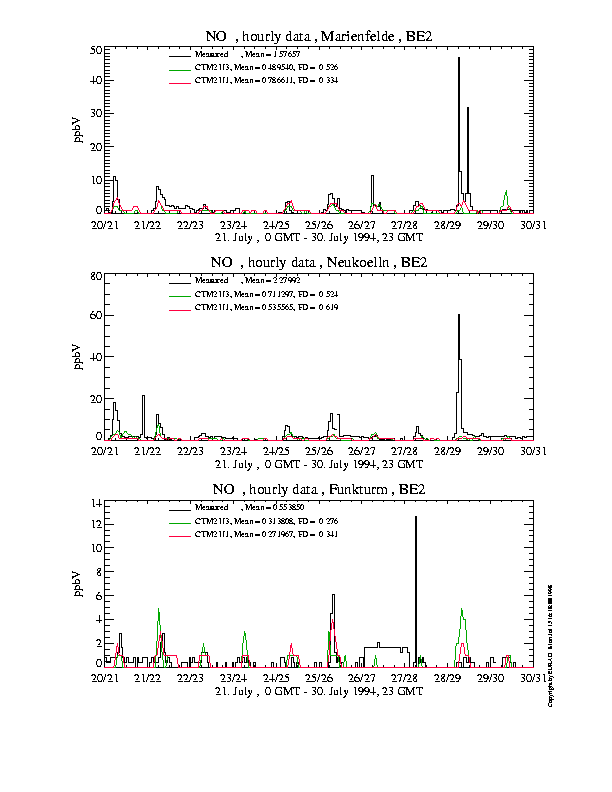
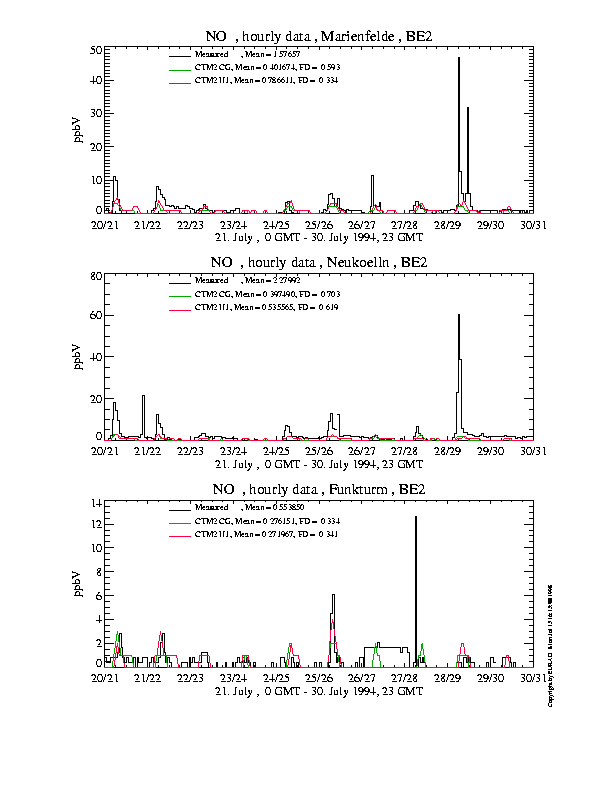
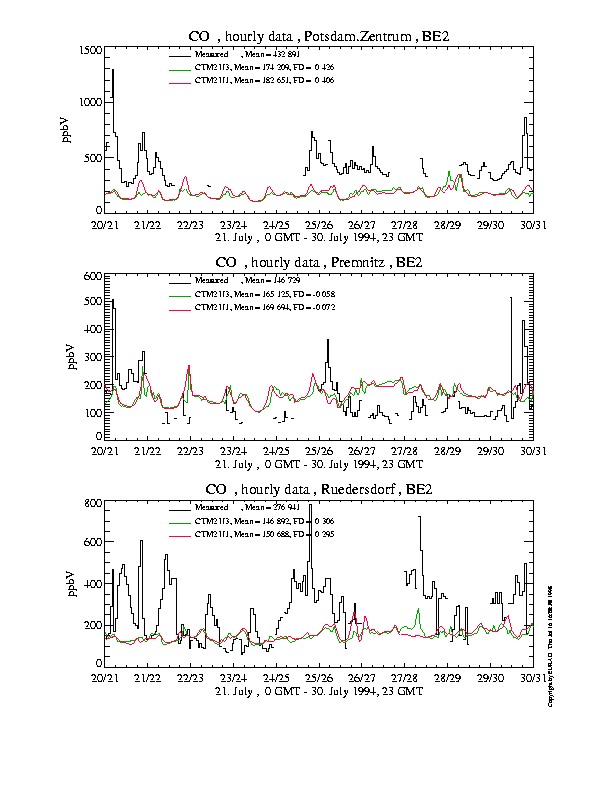
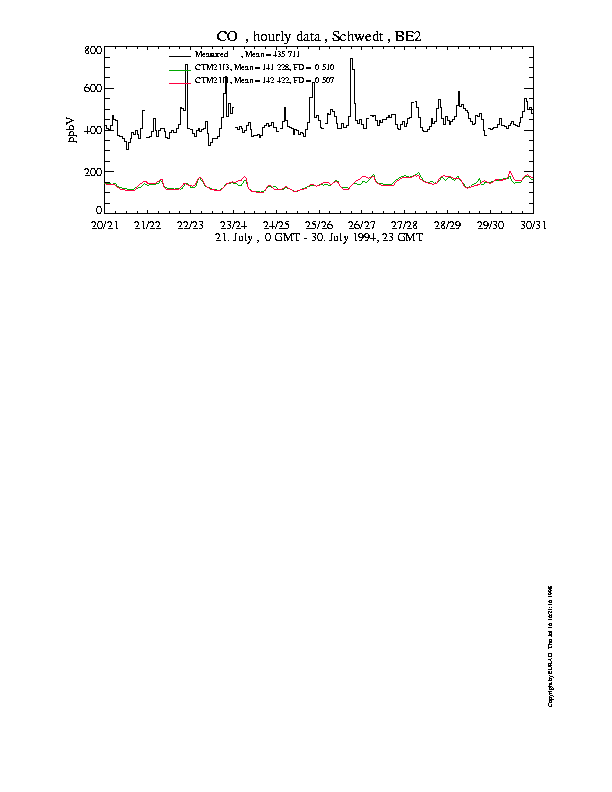
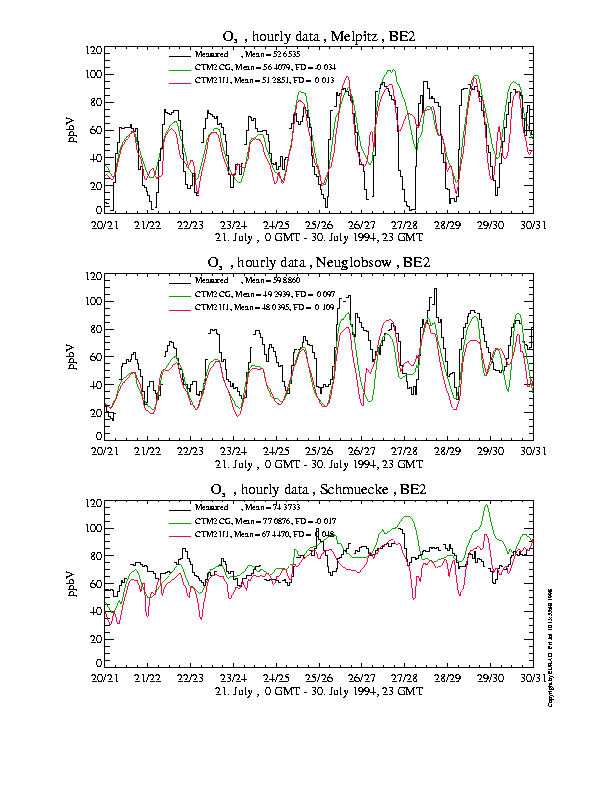
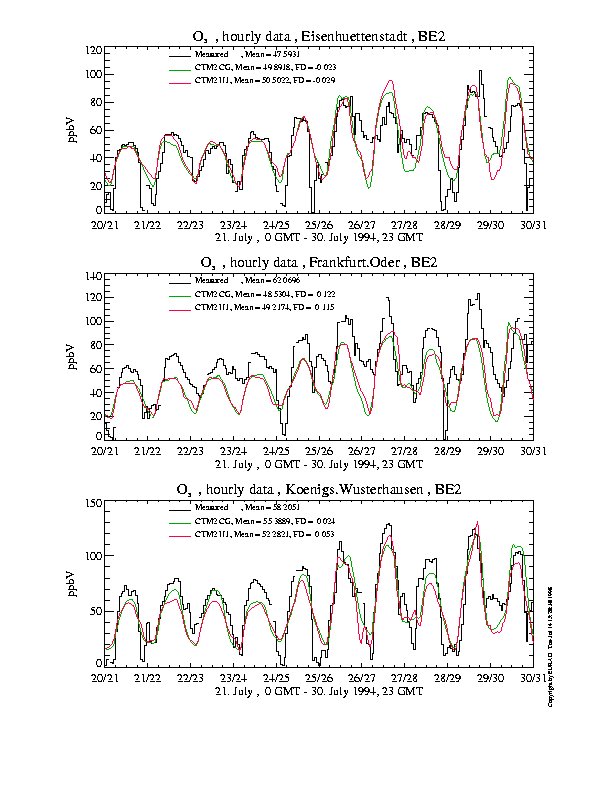
Some more examples of comparison of measurements with model simulations are given for Melpitz, Neuglobsow, Schmuecke (CG-N1), Eisenhuettenstadt, Frankfurt/Oder, Koenigs-Wustershausen (CG-N1), Prezlau, Schwedt (CG-N1) for CG and N1, for Premnitz and Schwedt for N3 and N1 (N3-N1). Some measurement sites in Berlin compared with simulations are for CG, N1 and N1, N3 given for Marienfelde, Neukoelln, Funkturm (CG-N1, N3-N1).
This report only is a first step. Further documentation will include the input data (emissions, landuse, topography) and meteorological simulations. Sensitivity studies currently are underway with respect to meteorology, input data and parameterizations. The results of these studies compared with the base case will be documented in updates of this report. Other constituents which have not been considered here, will be included. Simulations for the BERLIOZ experiment will be performed with the modeling design tested here with the summer smog episode of July 1994.
An extension of this report is available as postscript-document upon request. Any critical comments to this report are welcome and should be adressed to the contact persons.
Tel: ++49-221-400 2220
Fax: ++49-221 400 2320
![]()
The helpful discussions and comments with the colleagues involved in the planning of the BERLIOZ field experiment are gratefully acknowledged.
The general support by the EURAD group is gratefully acknowledged, in particular technical support by J. Reusch and H. J. Bock. Emission data preparation has been supported by B. Roeben, EURAD. Thanks also for helpful discussions with C. Kessler (EURAD), H. Feldmann (EURAD) and S. Tilmes (DWD).
Emission data has been provided by B. Wickert (IER, University of Stuttgart). Landuse data provided by Dr. G. Smiatek, IfU, Garmisch-Partenkirchen, to the data bank of the TFS-LT1 managed at the BTU Cottbus (Lehrstuhl für Umweltmeteorologie, Prof. E. Schaller) have been used. The preparation of meteorological input data for MM5 has been supported by Prof. P. Speth, Ilona Stiefelhagen and Birdie Roeben, University of Cologne.
The numerical simulations have been supported by the Research Centre Jülich, in particular ICG2 (H. Geiss, S. Jansen), ICG3 and ZAM and the RRZK of the University of Cologne. Data has been provided by EMEP, ECMWF, UBA, Environmental Agencies of the Federal states of Germany and the DWD. Financial support came from the Ministry for Education, Science, Research and Technology (BMBF) within the Tropospheric Research Program (TFS) and the Ministry of Science and Research (MSWF) of the Federal State Nordrhein-Westfalen.
![]()
I.J. Ackermann, H. Hass, M. Memmesheimer, A. Ebel, F.S. Binkowski, U. Shankar: Modal Aerosol Dynamics Model for Europe; Development and first applications. Accepted for publication by Atmos. Environm., 1997.
Bundesministerium für Bildung, Wissenschaft, Forschung und Technologie: Tropospheric Research Programme 1996 - 2002, Project Plan, Version 1.0. GSF-Forschungszentrum für Umwelt und Gesundheit, 107 pp., October 1997.
P. Bruckmann, M. Wichmann-Fiebig: The Efficiency of Short Term Actions to Abate Summer Smog: Results from Field Studies and Model Calculations. EUROTRAC Newsletter 19/97, 2 - 9, 1997.
A. Ebel, H. Elbern, H. Feldmann, H.J. Jakobs, C. Kessler, M. Memmesheimer, A. Oberreuter, G. Piekorz (with contributions from: I. Ackermann, H.J. Bock, M. Heupel, M. Ihrig, J. Kowol, V. Kutzschebauch, B. Roeben, B. Schell, H. Schmidt, R. Schumacher, S. Tilmes, J. Tippke, C. Ziegenbein): Air Pollution Studies with the EURAD Model System
EURAD - European Air Pollution Dispersion Model System. Mitteilungen aus dem Institut für Geophysik und Meteorologie, Hrsg. A. Ebel, M. Kerschgens, F.M. Neubauer, P. Speth, Universität zu Köln, Nr. 120, 1997.
H. Elbern, H. Schmidt, A. Ebel: Variational Data Assimilation for Tropospheric Chemistry Modeling. J. of Geophys. Res., in press, 1997.
R. Friedrich: GENEMIS: Assessment, Improvement, and Temporal and Spatial Disaggregation of European Emission Data. In: Transport and Chemical Transformation of Pollutants in the Troposphere, Volume 7 (Tropospheric Modelling and Emission Estimation, Ed.: A. Ebel, R. Friedrich, H. Rodhe), Part II, 181 - 214. Series editors: P. Borrell, P.M. Borrell, T. Cvitas, K. Kelly, W. Seiler. Springer 1997.
H. Hass, H.J. Jakobs, M. Memmesheimer: Analysis of a regional model (EURAD) near surface gas concentration predictions using observations from networks. Meteorol. Atmos. Phys., 173-200, 1995.
H. Hass, H.J. Jakobs, M. Memmesheimer, G. Piekorz and A. Ebel: Ermittlung des Eintrags von Ozon und Ozonvorläufersubstanzen nach NRW. Bericht zum F&E-Vorhaben 112-700 - EUR06A des Ministeriums für Umwelt, Raumordnung und Landwirtschaft (MURL) des Landes Nordrhein-Westfalen. Rheinisches Institut für Umweltforschung (RIU) an der Universität zu Köln, 1994.
H.J. Jakobs, H. Feldmann, H. Hass, M. Memmesheimer: The use of nested models for air pollution studies: an application of the EURAD model to a SANA episode, J. Appl. Met., Vol. 34, No. 6, 1301-1319, 1995.
M. Memmesheimer, H.J. Jakobs, G. Piekorz, A. Ebel, H. Hass: Grossräumige Ozon-Modellrechnungen mit verschiedenen Emissionsminderungsszenarien mit Hilfe des Modellsystems EURAD. Abschlußbericht zum Teilvorhaben A-3 des F&E-Vorhabens 104 02 812 des Umweltbundesamtes, im Auftrag der Prognos AG, F.V. Rheinisches Institut für Umweltforschung an der Universität zu Köln, November 1995, 228 pp.
M. Memmesheimer, M. Roemer, A. Ebel: Budget calculations for ozone and its precursors: seasonal and episodic features based on model simulations. J. of Atmos. Chemistry, 28, 283-317, 1997.
M. Memmesheimer, H.J. Jakobs, A. Ebel, J. Tippke, G. Piekorz, H. Geiss, S. Jansen, B. Wickert and U. Schwarz: Application of EURAD to the simulation of a summer smog episode in July/August 1994 with special emphasis on the urban plume of Berlin. In: Global and Regional Atmospheric Modelling, (eds. H. Hass, I.J. Ackermann), Aachen, Sept. 1997, 21-29, 1998.
M. Memmesheimer, H.J. Jakobs, J. Tippke, A. Ebel, G. Piekorz, M. Weber, H. Geiss, S. Jansen, B. Wickert, R. Friedrich, U. Schwarz, G. Smiatek: Simulation of a summer-smog episode in July 1994 on the European and urban scale with special emphasis on the photo-oxidant plume of Berlin. In: EUROTRAC Symposium 1998, Garmisch-Partenkirchen, im Druck.
M. Memmesheimer, J. Tippke, H.J. Jakobs, G. Piekorz, G. Schneider, M. Weber, A. Ebel, M. Kerschgens, H. Geiß, S. Jansen, B. Wickert, U. Schwarz, R. Friedrich, G.Smiatek: Summer smog simmulation July 1994. Status Report, Version 01, TFS_LT1: CT-Modeling with EURAD for BERLIOZ, Kön July 1998, 102 pp.
N. Moussiopoulos, P. Sahm, R. Kunz, T. Vögele, CH. Schneider, C. Kessler: High resolution simulation of the wind flow and the ozone formation during the Heilbronn ozone experiment. Atmos. Environm., 31, 3177 - 3186, 1997.
Th. Schoenemeyer, E. Schaller, S. Emeis: Ozonverteilung über Nordrhein-Westfalen und Einfluß von Emissionsreduktionsszenarien. Fraunhofer-Institut für Atmosphärische Umweltforschung. Garmisch-Partenkirchen, 1995.
G. Smiatek und R. Köble: Mapping land use and land cover in Europe. In: The Proceedings of the EUROTRAC Symposium '96 (ed.: P.M. Borrell, P. Borrell, K. Kelly, T. Cvitas, W.Seiler), Vol. 2, 69 - 72. Computational Mechanics Publications, Southampton, 1996.
B. Stark, H.-J. Abraham, P. Lenschow, M. Lutz, W. Reichenbächer, E. Reimer, B. Scherer: Flugzeug- und Bodenmessungen von Ozon und Vorläuferstoffen zur Abschätzung der Wirksamkeit der emissionsmindernden Maßnahmen im Großraum Berlin/Brandenburg (FLuMOB-Projekt). Abschlußbericht im Auftrag der Senatsverwaltung für Stadtentwicklung und Umweltschutz, Berlin, und des Ministeriums für Umwelt, Naturschutz und Raumordnung des Landes Brandenburg, Berlin, 1995.
R. Stern, J. Fath, E. Reimer: Bewertung der Effektivität von Ozonminderungsstrategien mit Hilfe des photochemischen Ausbreitungsmodells REM3. Abschluszlig;bericht zum Teilvorhaben A-5 im Rahmen des F&E-Vorhabens 104 02 812/01 'Aktionsprogramm und Maßnahmenplan Ozon' des Umweltbundesamtes, im Auftrag des PROGNOS AG Basel, September 1995, Freie Universität Berlin, Institut für Meteorologie, Troposphärische Umweltforschung, 181 pp.
R. Stern, B. Scherer, J. Fath, E. Reimer: Ermittlung und Bewertung von Ozonminderungsmass nahmen im Großraum Berlin-Brandenburg mit Hilfe des photochemischen Ausbreitungsmodells CALGRID. Freie Universität Berlin, Institut für Meteorologie, Abschlussbericht zum Teilvorhaben B-3 'Kleinräumige Ozon-Ausbreitungsrechnungen' im Rahmen des F&E-Vorhabens 104 02 812/01 'Aktionsprogramm und Maßnahmenplan Ozon' des Umweltbundesamtes, im Auftrag der PROGNOS AG Basel.
J. Tippke, M. Memmesheimer, H.J. Jakobs, G. Piekorz, M. Ihrig, C. Kessler, B. Roeben, A. Ebel: Ermittlung und Bewertung der Wirkungen von Ozonminderungsmaßnahmen im Großraum Dresden mittels Simulationsrechnungen mit dem EURAD-Modellsystem für die Episode Juli/August 1994. Abschlußbericht zum Leistungspaket B-3 im Rahmen des F&E-Vorhabens 104 02 812/01 'Aktionsprogramm und Maßnahmenplan Ozon' des Umweltbundesamtes, im Auftrag der PROGNOS AG Basel, F.V. Rheinisches Institut für Umweltforschung an der Universität zu Köln, September 1997. 178 pp.
J. Tippke, M. Memmesheimer, H.J. Jakobs, A. Ebel, A. Graff, G.B. Motz, A. Hartmann: Simulation of photo-oxidant formation on different horizontal scales with several emission reduction scenarios. In: EUROTRAC Symposium 98, Garmisch-Partenkirchen, im Druck.