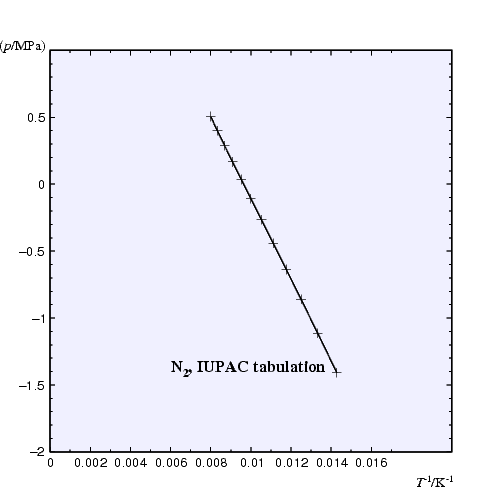
This example shows a so-called Clausius-Clapeyron plot of a vapour pressure curve. Temperatures are given in Kelvin (K), pressures in Megapascal (MPa). What we have to plot, however, is lg(p) vs. 1/T. The necessary transformations are specified as attributes of the curve tag pair in "reverse Polish notation":
x,inv"x,ln,2.303,/"Note that we mix roman and italic fonts in the axis labels.
We use the area tag to create a bluish background.
Here is the diagram source code:
<?xml version="1.0" encoding="UTF-8"?>
<!DOCTYPE cartesian SYSTEM "$GRXHOME/xml/cartesian.dtd">
<cartesian>
<area>
0.1 0.1
0.9 0.1
0.9 0.9
0.1 0.9</area>
<xaxis>
<xaxis y="ymax" numbering="none">
<yaxis majorincr="0.5" minorincr="0.1">
<yaxis x="xmax" numbering="none">
<comment>Vapour pressure data of nitrogen:
IUPAC Tables of the Fluid State</comment>
<curve xmathops="x,inv" ymathops="x,ln,2.303,/">
70.00 3.89770e-02
75.00 7.68048e-02
80.00 1.38047e-01
85.00 2.30481e-01
90.00 3.62470e-01
95.00 5.42780e-01
100.00 7.80490e-01
105.00 1.08503e+00
110.00 1.46645e+00
115.00 1.93608e+00
120.00 2.50822e+00
125.00 3.20673e+00</curve>
<text x="0.9" y="0.03"
xalign="right"><italic>T</italic><super>-1</super>/K<super>-1</super></text>
<text x="0.09" y="0.9" xalign="right">lg
(<italic>p</italic>/MPa)</text>
<text x="0.006xu" y="-1.4yu"
fontweight="bold" fontsize="14pt">N<sub>2</sub>
IUPAC tabulation</text>
</cartesian>

Click here for a PostScript file of this diagram, which can be printed at high resolution!