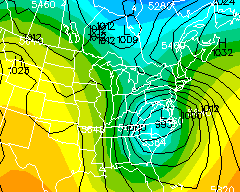
 Sample ECMWF 500 mb Forecasts
The extended range plots actually show two parameters: 500 mb heights (in color contours) and sea level pressure (in black line contours).
Sea level pressure
The sea level pressure field can be used to find low and high pressure systems as
well as the location of cold fronts. The highs and lows can be located by
the white H and L symbols on the map. Cold fronts will generally start from
areas of low pressure and follow the trough of low pressure south and to the
west of the low. Rain and/or snow is likely in the regions directly around
the low and somewhat less likely along the cold front.
500 mb heights
The 500 mb heights can be used to estimate surface temperatures since height
of a pressure surface is related to the mean temperature of the air below it.
Here is a rough estimate of temperatures based on color. The variability is
on the order of +-10 degrees F:

Height     Color          Hi Temp
5940-6000  Red              90
5880-5940  Red Orange       84
5820-5880  Orange           78
5760-5820  Yellow Orange    72
5700-5760  Yellow           66
5640-5700  Greenish Yellow  60
5580-5640  Yellowsh Green   54
5520-5580  Green            48
5460-5520  Cyanish Green    42
5400-5460  Greenish Cyan    36
5340-5400  Cyan             30
5280-5340  Blueish Cyan     24
5220-5280  Blue Cyan        18
5160-5220  Cyanish Blue     12
5100-5160  Blue              4
5040-5100  Magentaish Blue  -2
4980-5040  Blueish Magenta  -8
4920-4980  Magenta         -14
4860-4920  Medium Magenta  -20
4800-4860  Dark Magenta    -26
Modify these by:
Deserts           +20
Mid Summer        +10
Tropics            +5
Spring/Fall         0
Cloud cover        -5
Rainy areas       -10
Near Low Press    -10
Wintertime        -10
Snow cover        -10
Arctic Winter     -20
Current Images
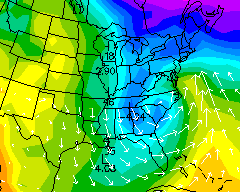 Sample ECMWF 850 mb Forecasts
The 850 mb chart details weather conditions at the 850 mb level or around 5000 feet above sea level. The parameters plotted are temperatures in Celsius (in color contours), and winds plotted as vectors.
850 mb temperatures The temperature field shows where warm and cold air are located. Temperatures at this level do not show the diurnal temperature changes from morning low to afternoon high we see at the earth's surface. You can determine potential afternoon highs from these temperatures by adding: 15C in the summer, 12C in spring and fall, and 9C in the winter and converting to Fahrenheit. For example, if the 850 temp is 4C in summer, the afternoon temperature could reach 4+15=19C=67F. This algorithm does not work in the western third of the country due to its high altitude.
The 850 temperature is also a decent indicator of the type of precipitation. Since most precipitation forms at 5000 feet or above, a temperature of freezing (0 Celsius) or below would indicate snow whereas a temperature above freezing would indicate rain.
850 mb wind vector field
The vector field shows wind direction and speed. Often this can be used to
qualitatively show areas of convergence and divergence. In the middle and upper
levels of the troposphere, this can be an indicator of existing upward (from
divergence) or downward (from convergence) air motion. Upward motion is often
linked to precipitation and downward to clear skies.
NOTE: The wind data are only broadcast out to 3 days and for a range of latitude from 35 south to 35 north.